Housing in the AACHD

Data-driven insights into housing conditions, population change, and development pressures shaping the district today.

Overview

This section presents demographic, housing, and development data that help explain the conditions facing the African American Cultural Heritage District today. Together, these indicators trace the lasting impacts of past policies, the shifting population and housing dynamics shaping the district, and the pressures residents face in securing affordable, stable housing. The data provide an essential foundation for understanding both the challenges and opportunities for preserving the district’s cultural identity and supporting its future.

Key Findings

Historic Context: Redlining & Segregation

The 1928 Master Plan

The City of Austin’s 1928 Master Plan formalized racial segregation in Austin when it designated East Austin as the “negro district,” moving Black Austin residents from their freedman communities throughout the City into what we know today as East Austin.

1934 Redlining

The redlining of Austin in 1934, which designated a majority of the district as hazardous, has impacted the development of the area we now know as the African American Cultural Heritage District.

The Master Plan states:

“In our studies in Austin we have found that negroes are present in small numbers, in practically all sections of the city, excepting the area just east of East Avenue and south of the City Cemetery. This area seems to be all negro population. It is our recommendation that the nearest approach to the solution of the race segregation problem will be the recommendation of this district as a negro district; and that all facilities and conveniences be provided the negroes in this district, as an incentive to draw the negro population to this area. This will eliminate the necessity of duplication of white and black schools, white and black parks, and other duplicate facilities for this area.”

Black & African American Population Trends

Between 2010 and 2020,  a substantial number of Black and African American residents moved away from East Austin. While Travis County, outside of Austin, saw the largest addition of Black and African Americans (24,135 individuals), Williamson County had the highest percentage growth in Black and African American populations during this time, increasing 69.5%, which equals over 20,000 individuals, across the decade.

Population by Age Group

Within the AACHD, the Black and African American population shows a distinct age distribution compared to the district overall. There are fewer residents in their mid-twenties to mid-forties and more in their mid-fifties to mid-seventies. This pattern likely reflects both the aging of long-term residents and the departure or displacement of younger Black households. The limited presence of mid-twenties to mid-forties residents may be tied to housing affordability challenges and the lower average household incomes of Black and African American households relative to other groups.

Demographic Overview

AACHD vs. City of Austin

At first glance, the demographics of the AACHD are not dramatically different from the City of Austin as a whole. The district has slightly fewer BIPOC residents and fewer children under 18, while overall appearing somewhat younger than the citywide average. However, when the data is disaggregated, stark differences emerge. The experience of Black and African American residents diverges significantly from that of Austin residents overall. Even though East Austin has historically been home to this community, their lived realities within the district are markedly different from those of their neighbors.

Black Homeowners vs. Renters

Black homeownership within the AACHD census tracts has declined significantly from 2010 to 2023, even as the number of Black renters has remained relatively stable. The trend, however, varies across the district. In the southeastern tract, Black homeownership has dropped sharply, while in the northern tract the number of Black renters has grown. These differences suggest that neighborhood-specific housing strategies will be necessary to both stabilize and increase the number of Black residents across the district.

Structures by Year Built & Neighborhoods

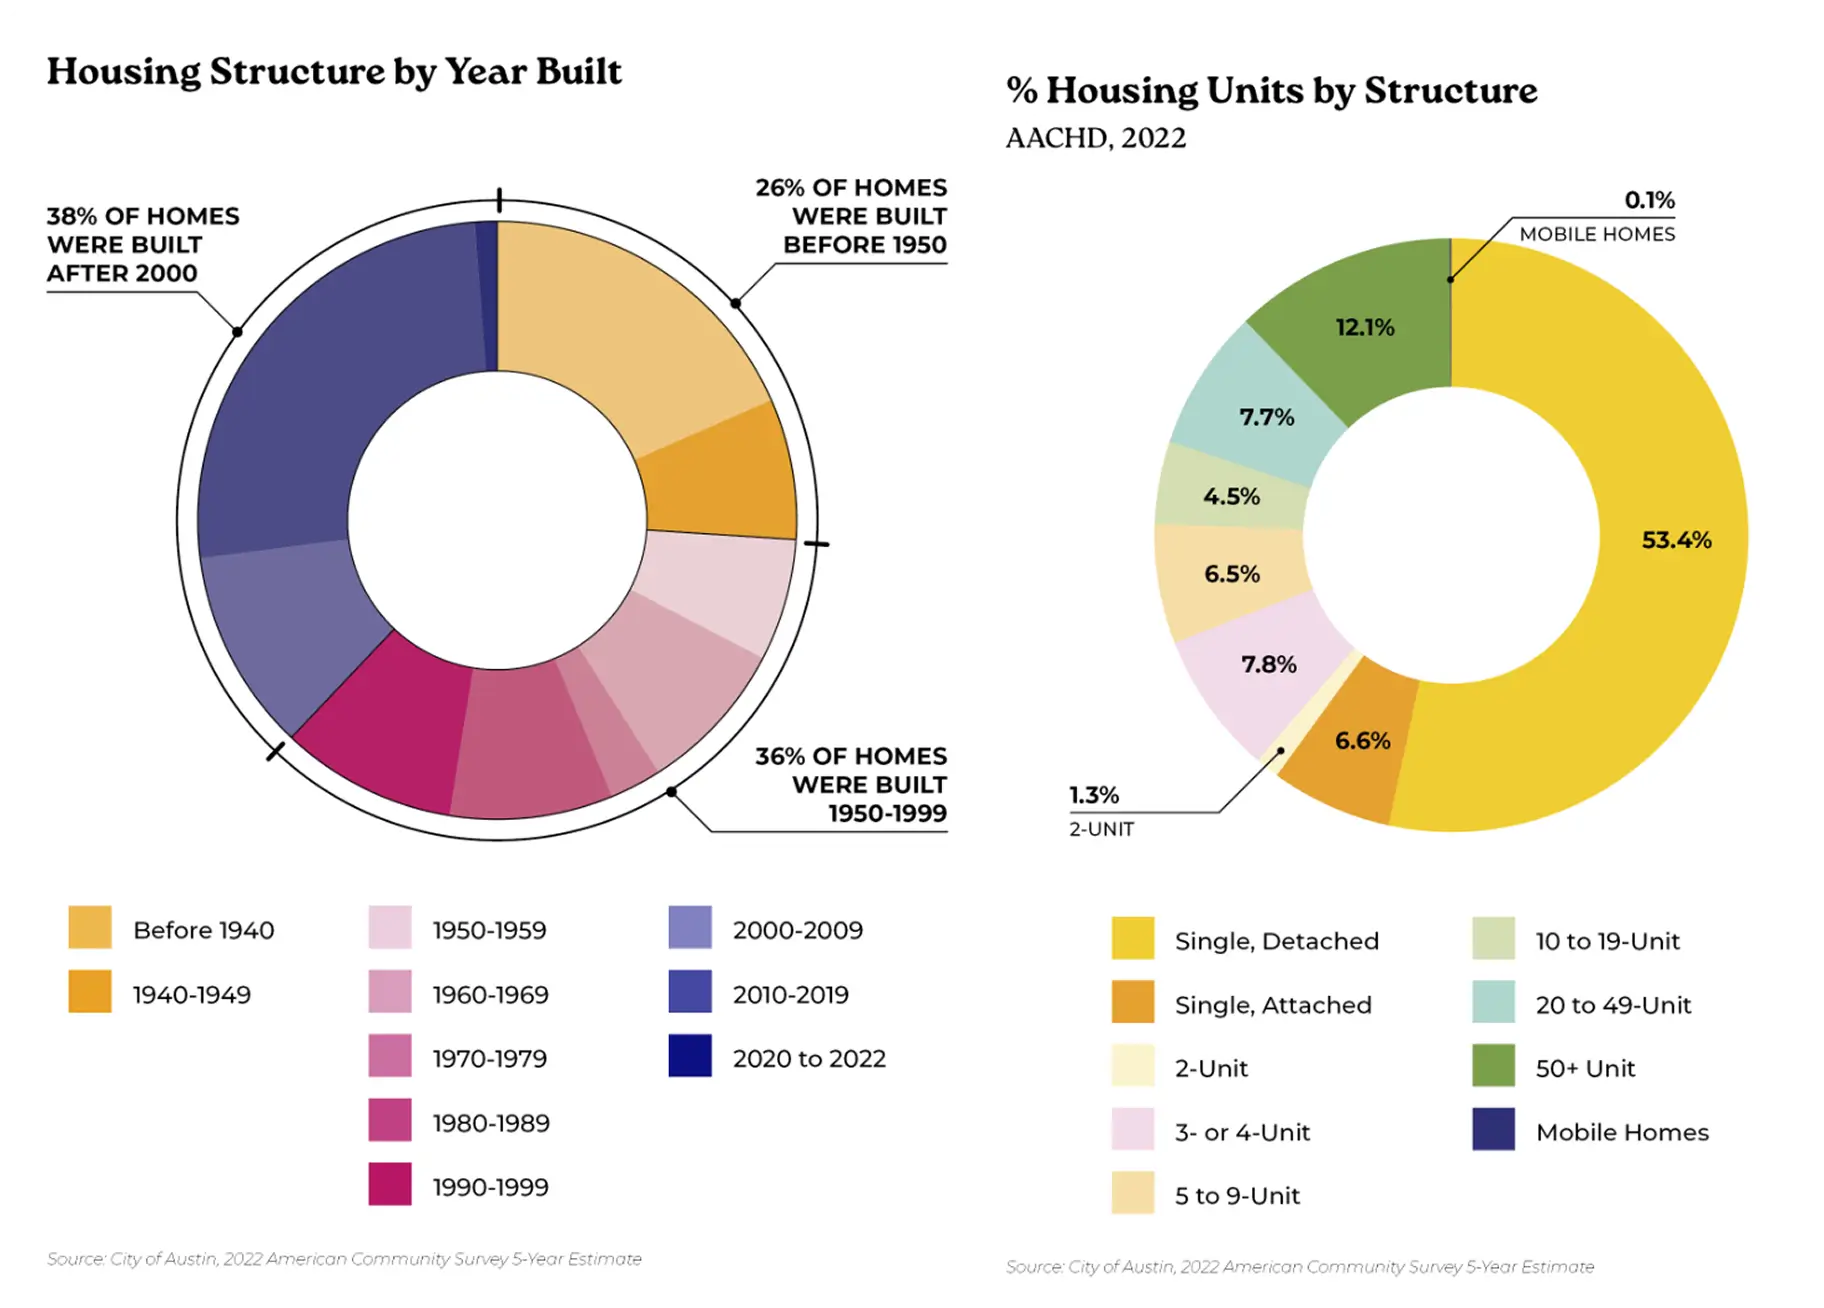
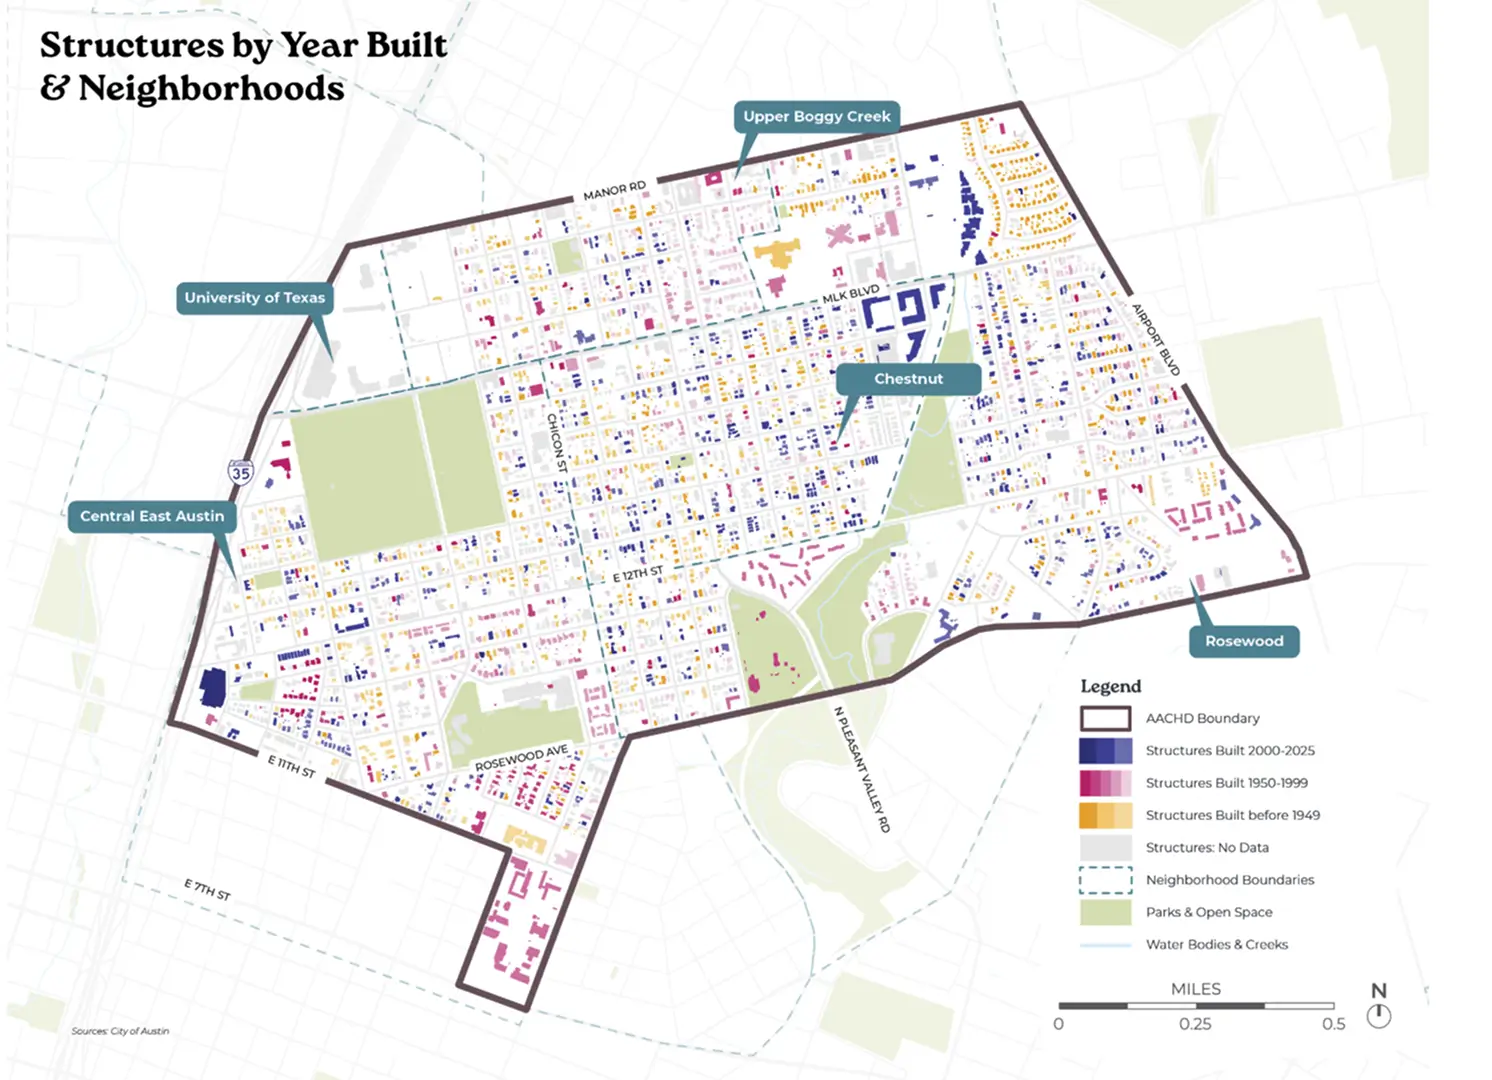
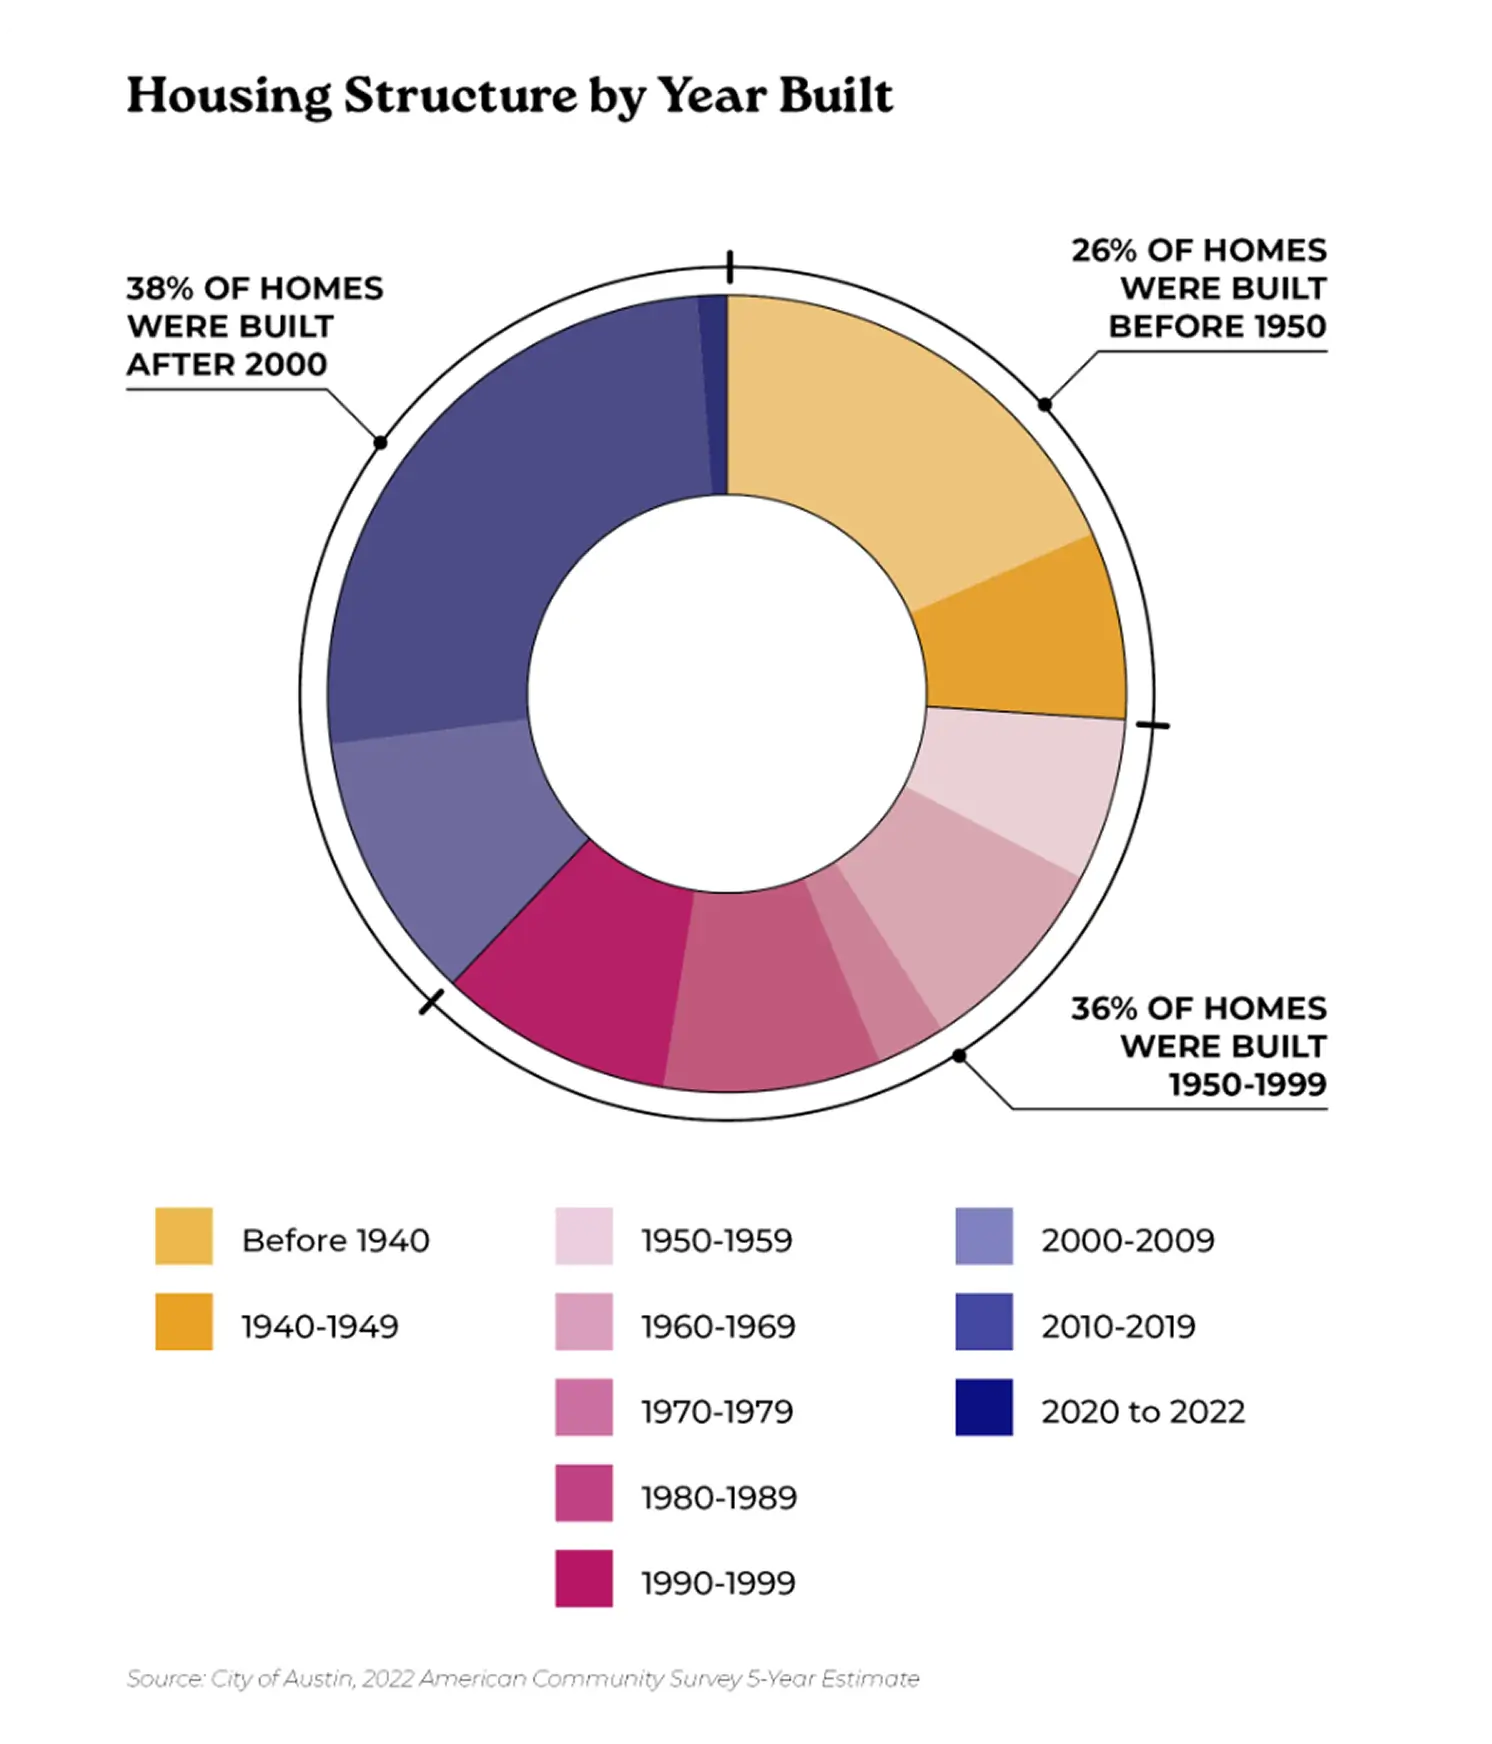
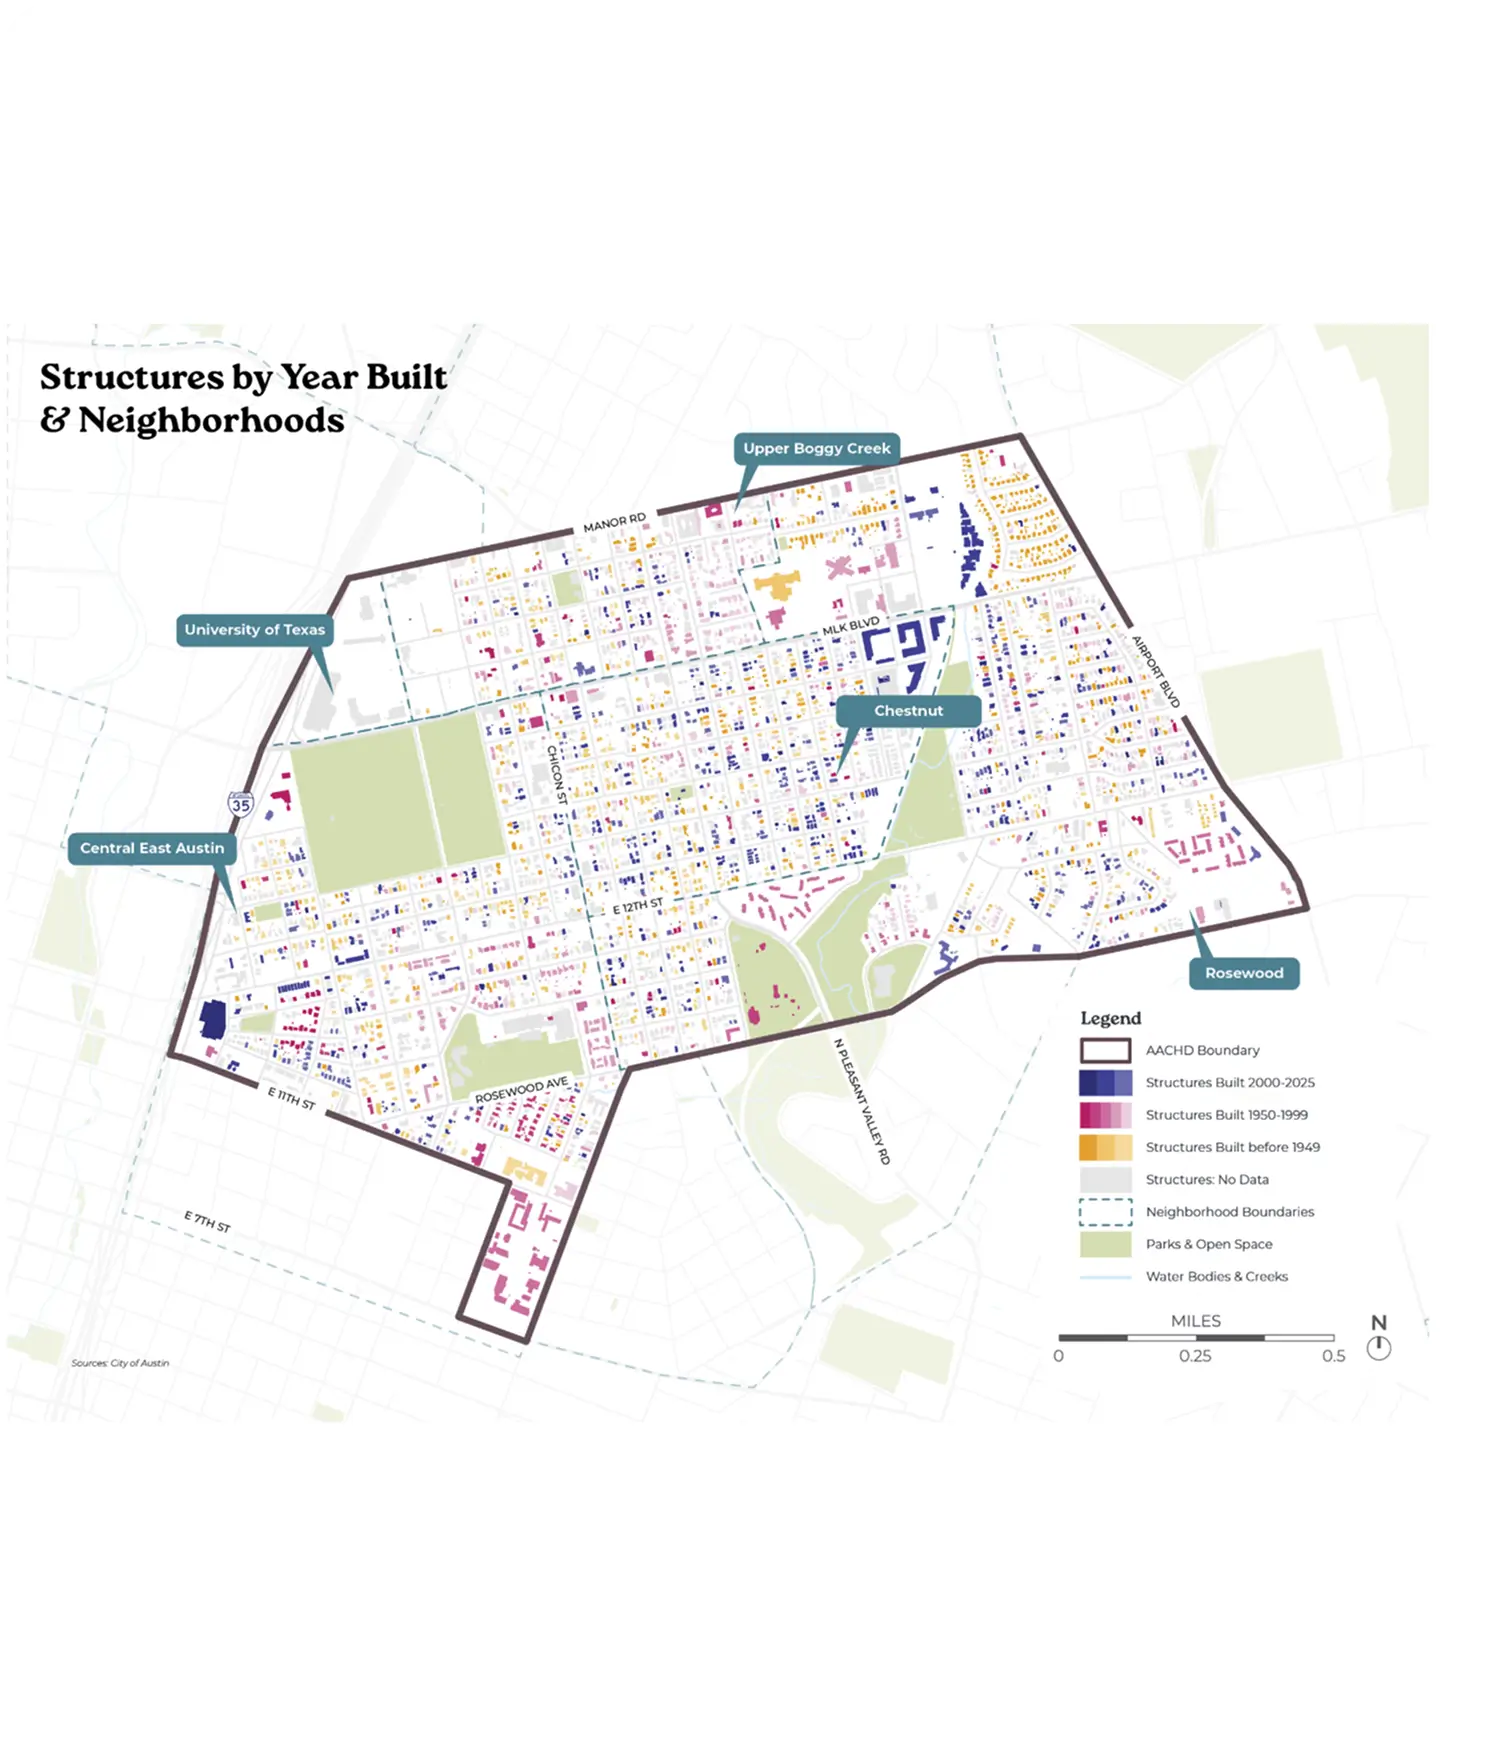
Structures in the AACHD are relatively new, on average, in comparison to the age of the neighborhood. In fact, 37.9% of the structures in the AACHD have been built since the year 2000. Conversely, only 26% percent of the structures predate the year 1950. Preserving the remaining older homes could be a significant goal of this process. 

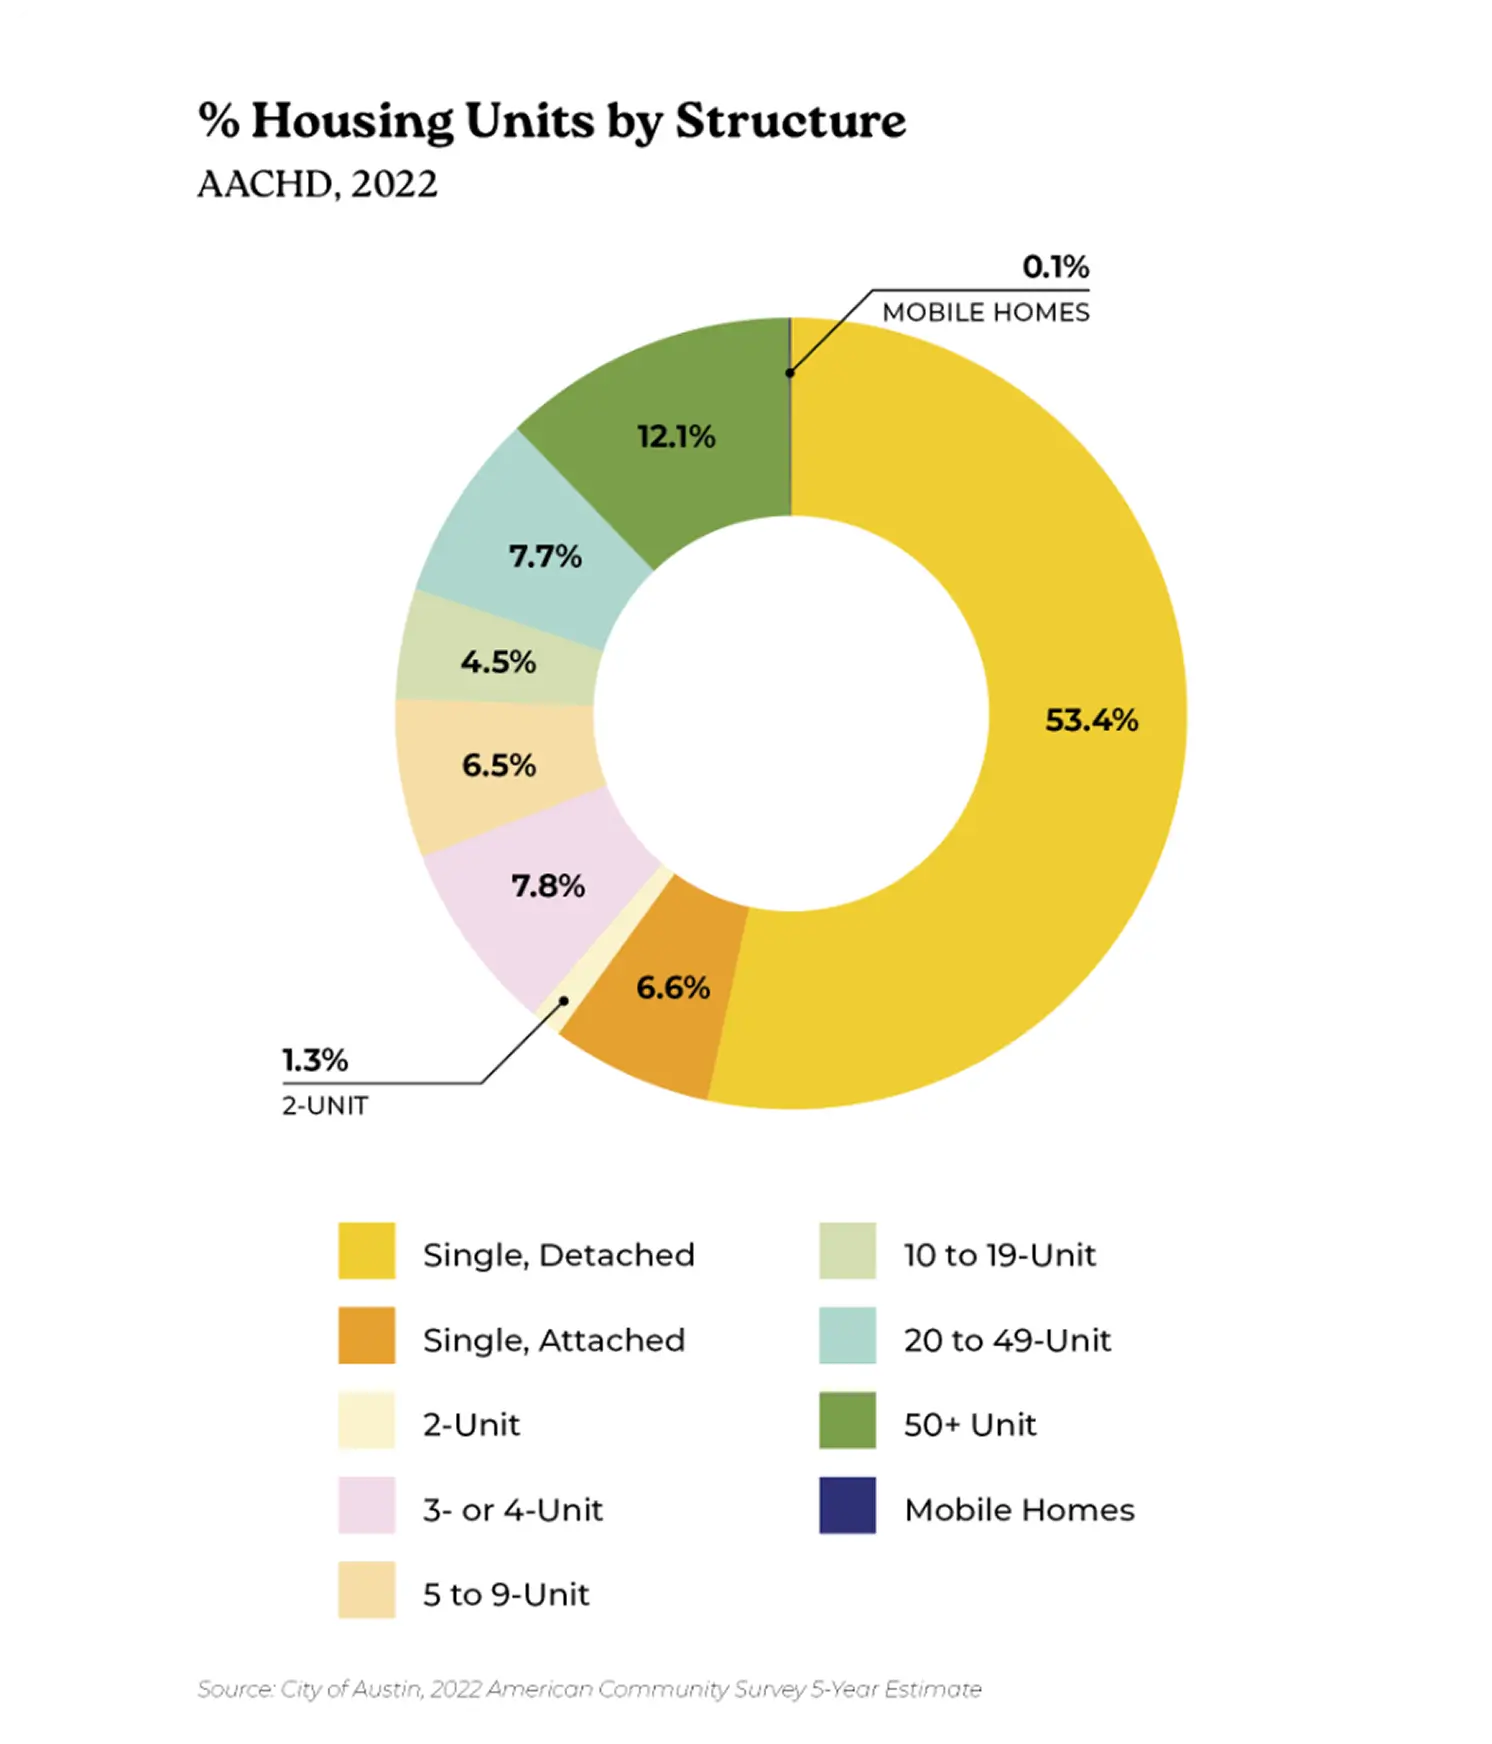
By units per building, 53.4% of the housing structures in the AACHD are single-family houses. The next highest category is 50+ unit structures at 12.1% of the housing structures in the AACHD. While the number of housing units produced has gone up significantly in the past 10 years, the average rent per unit has gone from $1,616 in 2016 to $1,858 in 2025 YTD.

Development & Improvements

The District includes a Transit-Oriented Development around the MLK Red Line station and Urban Renewal Districts along 11th and 12th Streets. Since 2010, a substantial number of new construction and reconstruction permits have been issued within the AACHD census tracts, signaling significant investment in housing. However, relatively few of these projects have contributed to the supply of affordable housing in the area.

Current Zoning

Much of the district is primarily zoned for single-family residences, with commercial and mixed-use zoning along major corridors - Manor Road, MLK Boulevard, 12th Street, 11th Street, and Airport Boulevard.

Help shape the future of our community through the AACHD Strategic Plan.